
about Audio, High Fidelity
& Home Entertainment technologies
pid: 662-2026/10/21 (v1.2)
Privacy Policy
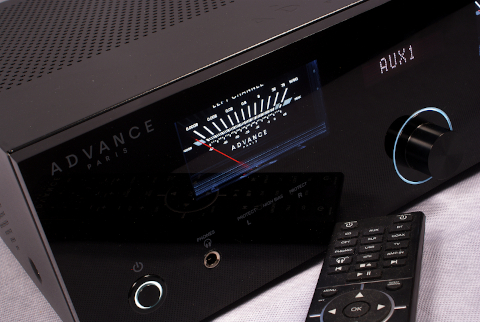
At a distortion level of 0.3% (THD+N), the amplifier lives up to the manufacturer's claims, delivering 2*77Wrms and 2*101Wrms into 8Ω and 4Ω loads, respectively. The power increase factor is 1.3, entirely reasonable for the A8 Apex's intended role. This amp was not designed to be a... powerhouse, but rather a medium-power amplifier. Nevertheless, with a damping factor close to 140, it should have no trouble driving loudspeakers with demanding impedance characteristics, whose impedance variations are not expected to affect the system's frequency response.
The statically measured distortion figures reveal a classic but carefully executed design. With 8Ω loads, both total harmonic distortion (THD) and total harmonic distortion plus noise (THD+N) remained around 0.03%, with only slight increases as a function of frequency. Performance changes little with 4Ω loads, which is a positive result. The lower load impedance does appear to affect the increase in distortion with frequency; however, at 4Ω, we measured values around and above 0.04% with a 10kHz signal. Intermodulation distortion showed similar characteristics, remaining slightly above 0.02% with both 8Ω and 4Ω loads.
The amplifier proved reasonably quiet, with a signal-to-noise ratio reaching -79dBr(A), referenced to the level corresponding to 1Wrms into 8Ω. Power-supply noise contributed just over 1mVrms at the output.
The amplifier's frequency response into a resistive 8Ω load is exemplary, extending comfortably beyond the measurement limit of 60kHz, with a gentle roll-off at the low end (-2.5dB at 10Hz) and excellent channel matching. The slight rise in the very high frequencies above 30kHz is negligible, amounting to around 0.1dB.
With a complex load connected to the output, the amplifier's behavior remains virtually unchanged. The corresponding curves show some deviation between 2 and 6kHz, but the variation remains below 0.1dBr. This is what we would expect given the damping factor.
The amplifier's phase response is similarly smooth, with only small, gradual variations, particularly above 100Hz, where the group delay appears to be minimal.
)
)
Frequency response of both channels. Reference level: 1/3 Pmax. 8Ω load (green/red traces); complex load (orange/purple traces).
Magnitude and phase response. Reference level: 1/3 Pmax (green and pink traces, respectively).
The output spectrum with a 1kHz input signal, measured at one-third of the maximum power into 8Ω, contains a prominent second harmonic, albeit at a low level of -70dBr. All the remaining components, from the fourth harmonic upward, lie below -100dBr.
The picture changes very little with a 4Ω load. The second harmonic remains at the same level, while only the higher-order harmonics, above the fourth, become stronger than in the 8Ω measurement. The power supply also becomes slightly noisier with the lower load, although its contribution remains very low. This suggests that the power supply is one of the mechanisms that ultimately limits the amplifier's performance, although on a rather small scale.
)
)
Harmonic spectrum for a 1kHz signal. Reference level: 1/3 Pmax/8Ω.
Harmonic spectrum for a 1kHz signal. Reference level: 1/3 Pmax/4Ω.
Intermodulation distortion remained low. The higher-order components (third-, fifth-, and seventh-order) were all well below -100dBr, with only the third-order components sitting marginally above that level. The first-order component was just below -70dBr.
The change in behavior with a 4Ω load is again minor, with a slight increase in the noise floor and in the levels of the higher-order components. The first-order component, meanwhile, is somewhat lower, at around -80dBr.
)
)
Intermodulation spectrum. 19kHz/20kHz signals, 1:1 ratio. Reference level: 1/3 Pmax/8Ω.
Intermodulation spectrum. 19kHz/20kHz signals, 1:1 ratio. Reference level: 1/3 Pmax/4Ω.
The noise spectrum, measured with no input signal, confirms the findings of the static measurements and the 1kHz spectra under load. The power supply's presence is clearly visible, but its components remain at low levels, all below -80dBr. The upper part of the spectrum is clean, with only small peaks around -110dBr.
With an 8Ω load, THD+N increases with frequency, reaching 0.04% at the upper measurement limit of 20kHz, under demanding conditions, with an output power of 1Wrms.
)
)
Noise spectrum with no input signal. Reference level: 1kHz, 1Wrms/8Ω.
THD+N versus frequency. Output power: 1Wrms/8Ω (green trace), 10Wrms/8Ω (red), 1/3 Pmax/8Ω (orange).
With a 4Ω load, the overall behavior remains much the same, although the values are slightly higher and the upward trend begins at a somewhat lower point.
The variation in distortion with output power holds no surprises. On the contrary, the amplifier exhibits a broad operating range over which distortion remains relatively constant, between 2Wrms and 40Wrms, fluctuating between 0.02% and 0.03%. The first signs of overload appear just above 70Wrms into 8Ω and 95Wrms into 4Ω.
)
)
THD+N versus frequency. Output power: 1Wrms/4Ω (green trace), 10Wrms/4Ω (red), 1/3 Pmax/4Ω (orange).
THD+N versus output power. 8Ω load (green trace) and 4Ω load (red trace).
The A8 Apex performs very well with fast transients, as shown by its response to a square wave. The resulting waveform exhibits neither overshoot nor signs of ringing. Rise time was measured at 1.18μs, and slew rate at 45.6V/μs, comfortably exceeding the minimum required under the measurement conditions.
Finally, the high-frequency noise spectrum is very clean, with only low-level components. By this measure, the amplifier does not appear to generate high-frequency noise of its own or pick up such noise from its surroundings.
)
)
Response to a 1kHz square wave. Maximum output voltage into an 8Ω load. Horizontal scale: 1μs/div; vertical scale: 10V/div.
Broadband noise spectrum. Span: 10MHz; center frequency: 4.8MHz.
Previous | Next | More Reviews
The .gr Domain
